 English
 Deutsch
 Français
 Português
 Español
 Bahasa Indonesia
 Tiếng Việt
 日本語
日本語
 한국어
한국어
 中文
中文
 ภาษาไทย
 العربية
 Русский
🚀 Cryptocurrency Pair Trading 2026: The Era of Automation with PairTrading.Pro
But there is a problem: doing this manually is difficult. You need to monitor the chart 24/7, calculate proportions in Excel, and instantly open short and long positions on the exchange. We solve this problem with the PairTrading.Pro ecosystem.
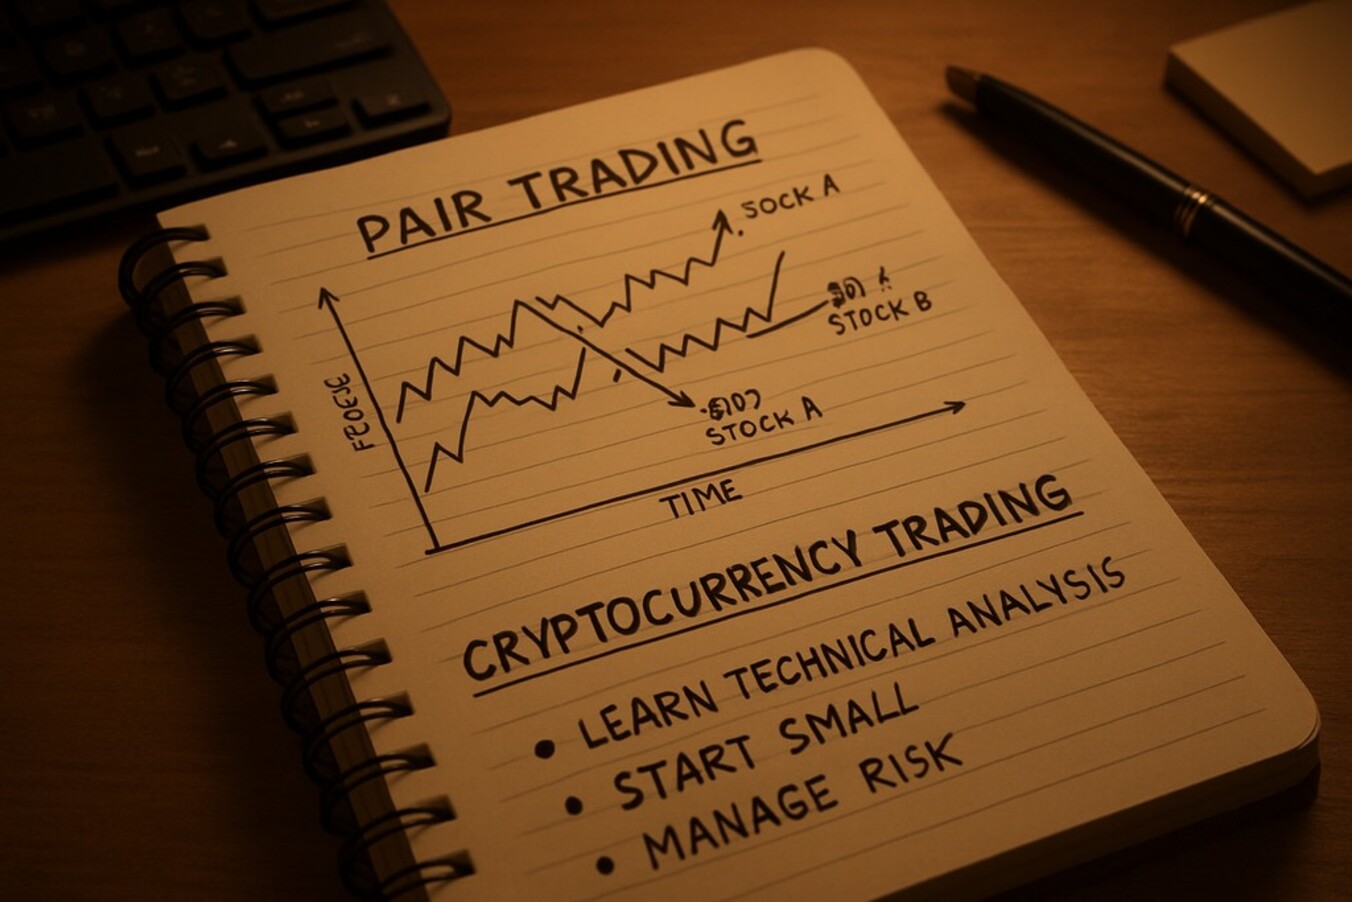
🧠 Foundation: Why are "Two Assets Better Than One"?
The "Spring" Philosophy
Imagine two assets that are fundamentally linked. For example, Arbitrum (ARB) and Optimism (OP). These are two competitors on Ethereum L2 technology.
- If the market goes up, both go up.
- If the market goes down, both go down.
- Anomaly: Sometimes one asset "runs away" from the other without a reason (due to news noise or the actions of a large market maker).
At this moment, an invisible "spring" is stretched between them. A pair trader bets not on the price of ARB or OP, but on the fact that the spring will snap back.
❓ Q&A: Math in Simple Terms
What do we base our decisions on? We don't need to guess. We rely on two mathematical pillars:
- Correlation: Assets move synchronously (Coefficient > 0.8).
- Cointegration: The distance between assets (Spread) always tends towards a mean value. This is a guarantee that the "divorce" of assets will not be eternal.
🛠️ Toolkit: Bollinger Bands and Spread
Instead of looking at two price charts, we look at one chart — the Spread Chart.
What is Spread (Ratio)?
This is the ratio of the price of one asset to another. The formula looks like this:
Ratio=Price of Asset A (Long)Price of Asset B (Short)
Visualization: Bollinger Bands
This is the best visual indicator for pair trading. It builds a dynamic channel around our Spread:
- Middle Line (SMA): This is the "Fair Price" of the relationship. The magnet to which the spread strives.
- Upper Band: Overbought zone. The spread is too expensive (Asset A has risen too much relative to B).
- Lower Band: Oversold zone. The spread is too cheap (Asset A has fallen too much relative to B).
🤖 Strategy Automation on PairTrading.Pro
Forget about TradingView and Excel. In 2026, professionals use specialized software. PairTrading.Pro takes care of calculations, charting, and, most importantly, order execution.
📢 Why do professionals choose PairTrading.Pro? The platform provides unique functionality for systematic trading:
- Spread Builder: The ability to choose different weighting models to create the ideal synthetic pair.
- Backtesting: Functionality to test hypotheses on historical data before risking real money.
- Multi-exchange access: Simultaneous management of accounts on various exchanges (Binance, Bybit, etc.) through a single interface.
Step 1: Spread Builder
You don't need to manually divide prices.
- Log in to the PairTrading.Pro terminal.
- Select Asset A (e.g., ETH) and Asset B (e.g., BTC).
- The platform instantly builds a synthetic chart of the ETH/BTC ratio.
- You see the history of how the "strength" of Ether has changed relative to Bitcoin.
Step 2: Bollinger Bands Setup
The platform overlays the indicator directly on the spread chart.
- Period: Usually set to 20 or 50. This is the number of candles for calculating the average.
- Deviation: Industry standard is 2.0. This is the channel width.
- Aggressive: 1.8 (more trades, higher risk).
- Conservative: 2.5 (sniper entries, fewer trades).
Step 3: Launching the Bot (Auto-Execution)
This is the main feature. You will never be able to manually open two trades perfectly synchronously. The PairTrading.Pro bot does this in milliseconds.
Bot Logic:
- Entry Trigger: The spread candle touched or closed outside the Bollinger Band.
- Action: The bot sends orders to the exchange via API.
- If the Lower Band is touched → The bot buys Asset A and sells Asset B for equal amounts.
- If the Upper Band is touched → The bot sells Asset A and buys Asset B.
- Exit Trigger: The spread returned to the Middle Line (SMA).
- Action: The bot instantly closes both positions, securing the difference (profit).
💼 Case Study: The "AI Revolution" Trade (FET vs RENDER)
Let's look at how the platform would have handled a real market situation.
Context: The Artificial Intelligence (AI) sector is storming. Tokens FET and RENDER usually move as a pair, but news came out about RENDER partnering with a major studio.
Situation on the PairTrading.Pro Chart:
- RENDER price skyrockets.
- FET price stands still.
- The Spread (FET / RENDER) falls sharply, breaking through the Lower Bollinger Band.
Bot Reaction (Entry):
- The bot sees the lower boundary touch.
- Instantly opens positions for $$5,000$$$ each:
- ✅ LONG FET (Betting that it will "catch up").
- ❌ SHORT RENDER (Betting that it is overheated and will correct).
Development of Events (after 12 hours):
- The hype around the RENDER news subsides, speculators take profits. RENDER falls by 5%.
- FET begins to grow as liquidity flows into lagging coins in the sector. FET grows by 3%.
Result on the Chart:
- The Spread (FET / RENDER) reverses and goes up, towards the middle line.
- As soon as the price touches the SMA middle line, the PairTrading.Pro bot closes the trade.
Financial Result:
- Short RENDER: Generated profit (price fell). +5% of +250$$$.
- Long FET: Generated profit (price rose). +3% of +150$$$.
- Total: $$+400$$$ net profit in 12 hours.
- Note: The bot worked automatically while you were sleeping.
🔍 How to Choose Pairs in 2026?
Even the smartest bot won't save you if the pair is chosen foolishly. In PairTrading.Pro, use the built-in correlation screener or choose pairs from the same sector.
Top Categories for Monitoring:
-
Stablecoin Battles (Low Risk):
- Examples: USDC / USDT or FDUSD / USDT.
- Essence: The spread fluctuates in hundredths of a percent. Large leverage (x10-x20) can be used. The bot will scalp micro-deviations from the 1:1 parity.
-
Liquid Staking (LSD):
- Examples: LDO / RPL or ETH / stETH.
- Essence: The fundamental link is rock solid. Divergences happen rarely and close quickly.
-
Meme Coins (High Risk/Reward):
- Examples: DOGE / SHIB or PEPE / WIF.
- Essence: These assets move purely on crowd psychology. Volatility is insane, Bollinger Bands widen. Profits can be huge, but risks are also higher.
⚠️ Risk Management: How Not to Lose Your Deposit
In pair trading, risks differ from standard trading. Since we cannot place an automatic stop loss on the spread itself within the platform, risk control is carried out through capital management.
-
Position Sizing: Never enter a single pair with your entire deposit.
- Golden Rule: Allocate no more than 5-10% of your total capital to one pair.
- If the pair starts "Decoupling" for longer than you expected, you must have a margin buffer to wait out this period.
-
Basket Diversification: Do not rely on one pair.
- Run PairTrading.Pro bots on 3-5 different pairs from different sectors simultaneously (e.g., one stablecoin pair, one L2, one DeFi).
- If one pair glitches or sustains a temporary loss, profits from other pairs will cover it.
-
Fundamental Filter (Bot Pause): Pair trading works on statistics, and news breaks statistics.
- If you know that tomorrow there is an important Fed rate decision or a major network upgrade for one of the coins — it is better to pause the bot.
- Wait out the news storm and turn the bot back on when the market calms down.
-
Slippage: With strong volatility, prices change instantly.
- PairTrading.Pro algorithms are optimized for fast execution to minimize the difference between the signal price and the entry price, but on an extremely thin market, always be careful with volume.
🎯 Summary
In 2026, pair trading ceased to be the lot of hedge funds with billion-dollar capitals.
- Strategy: Mean Reversion. We wait for the elastic band to stretch (touching Bollinger Bands) and enter on the rebound.
- Tool: PairTrading.Pro. We don't build charts by hand. The platform provides quotes, draws channels, and shows entry points.
- Execution: Automation. The bot enters and exits the trade with surgical precision, eliminating emotions.
Your task now is not to "trade," but to be a system operator: choosing the right pairs, adjusting channel width, and monitoring risks. Welcome to smart trading! 🚀
✍️ Author: JohnM #PairTrading #StatisticalArbitrage #Crypto2026 #AlgoTrading #PairTradingPro #MeanReversion #Automation